The flammability triangle can serve as an immensely useful resource to plan safe cargo operations on board a ship, but merely seeing the flammability chart isn’t sufficient unless you are able to decipher what the various lines on the graph mean. Learn more about it in this article.
Introduction
In the previous article we learnt about the flammability triangle in relation to Inert gas systems used on board ships. In this article we will dissect the chart a bit more in order to understand how the properties vary with respect to variation in hydrocarbon concentrations.
Understanding the Graph
Although you must have seen the diagram in the previous article, I suggest you go through it once again and refresh your memory before proceeding to study this article so that you do not have any difficulty understanding it.
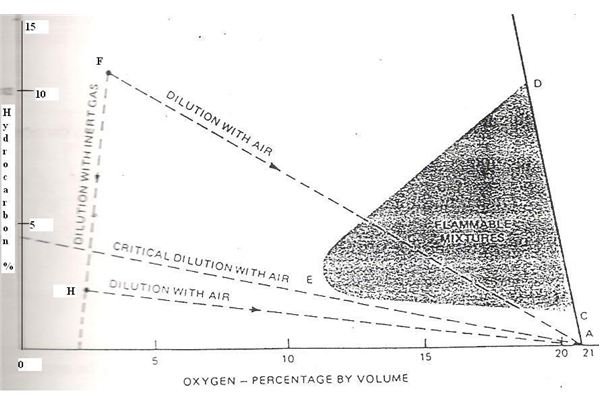
The line AB represents the condition when not inert gas is present in the mixture and there are purely air and hydrocarbon gas vapours (arising out of the oil stored in the tank). This and the flammable range in this condition is the straight line between C and D on the line A and B; anything above and below the same being safe.
When inert gas is introduced inside the tanks the situation changes dramatically and the region towards the left hand side of the line AB represents inert gas addition. As the inert gas content increases, the oxygen content reduces and so does the flammable range decrease in proportion with it. The lower flammable range progresses along the line CE while the upper flammable limit decreases rapidly (as seen from the slope of the line in the graph) along the line DE. Finally both these lines merge at point E.
If any component of the mixture is either increased or decreased, these changes are depicted by the dashed lines AF, AG, AH and FH, where point A represents a condition of pure air presence without any hydrocarbon or inert gas in the mixture.
Safe Transition Between Two Points on the Graph
You can draw one important observation from the graph that if the condition inside the tank is at point F it means the mixture is totally safe and is filled with inert gas. So once this gas is freed or released and the mixture progresses towards the point A along the line FA it will pass through the deadly black shaded portion which is dangerous. Hence the safe method is to reach F to A via H and not directly. This means adding additional inert gas along the process so that the black shaded region is bypassed and this is known as purging.
Hence you see that a simple operation of filling and emptying a cargo tank full of crude oil or any similar cargo could be dangerous if one is not familiar with the science of flammability. In the next article we will learn about methods associated with the gas exchange process.